Here’s the Devpost link to our final submission and the original repository. In my fork of the repo, we have continued development and added some features after the competition was over.
Problem Statement
Rohde & Schwarz tasked the attending teams with developing a satellite constellation intended for air traffic communication. Several factors had to be taken into account, including the Doppler shift, guaranteeing full coverage of fixed geographic regions at all times, and the directionality of the planes’ communication antennas.
Inspiration
Using physics and symmetry to get a rough understanding of the task and simulate the problem to attain a working solution.
What it does
In this challenge, we were supposed to propose a satellite constellation that fulfills several geometrical constraints. We have found such a solution, which can be found in our GitHub repository in the 3D folder. On the way to the solution, we developed a 2D and 3D representation of the coverage of a given satellite constellation that helps visualize satellite paths, their coverage range, and shows that we have found a feasible solution.
How we built it
Since the problem statement itself is quite complicated, our main focus at the start was to gain a better understanding of the problem, and decide how to approach it. We started by trying to mathematically characterize the problem - specifically the constraints. We were able to simplify the problem, by assuming the earth’s surface is covered in planes flying in every direction at the same time. This transformed it into a pure coverage optimization problem, without any moving planes on earth, just moving satellites. After gaining some insight on how to determine which points on earth are covered by a given satellite, we decided to create a 3D simulation (using Unity) and a 2D visualization (using Matplotlib). The 3D Simulation uses shaders to compute and visualize the sections covered by the satellites, the 2D visualization uses equirectangular projection to calculate the covered areas.
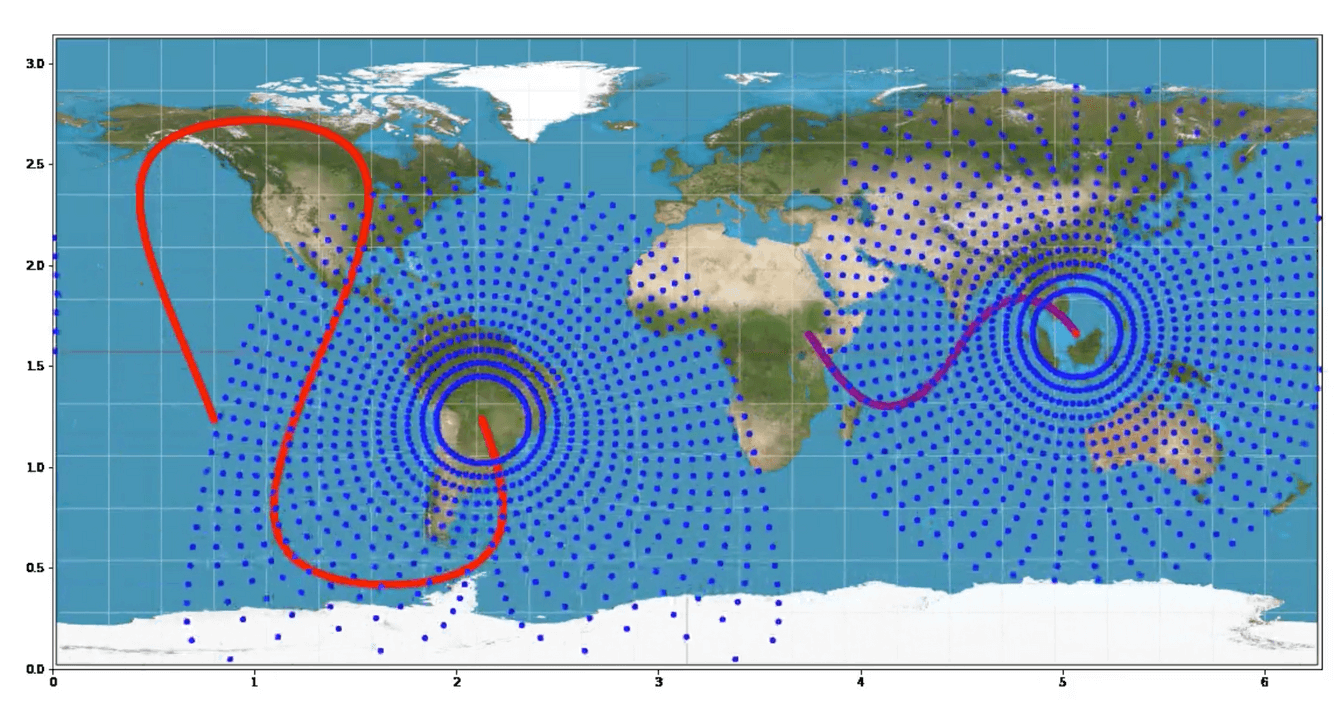
Using the 2D simulation, we were able to get an intuition for the coverage of an orbiting satellite. The map projection leads to these distorted looking coverage cones.
In the 3D visualization, the coverage area of the satellite is marked in green, with red and blue regions indicating that the doppler shift has exceeded the acceptable threshold. Since planes and satellites may move in opposing directions, the communication signal will get shifted by the doppler frequency. If this frequency shift is too high, communication becomes impossible.
Both visualizations together gave us the ability to validate and test new satellite configurations. We opted to use 8 satellites in geostationary orbit to cover a majority of the planet around the equator. To cover the Poles, we used 6 rings of satellites, each containing 9 equally spaced satellites in geosynchronous orbits. This constellation guarantees constant coverage of all geographic regions at all times.
Finally we also simulated which satellites would be connected to a given geo-region at a given time, handling cases where multiple satellites may be able to service a region simultaneously. This boils down to a bipartite graph matching problem and is visualized in the following video (line of the same color as the pizza slice indicates the satellite is matched to the region. Equatorial satellites are excluded from the visualization):
Challenges we ran into
- Extracting the relevant (quantifiable) constraints of the numerous ones that were imposed in the problem
- Continuous (double) coverage of the Northern and Southern Hemisphere
- Correct Calculation of Doppler Shift
- Rigorous (parametrized) definitions of sectors on earth
- Correct visualization of visibility cones on the 3D geometry
- Realization that the coordinates of vectors in a basis of a rotating reference frame vary contravariant, thus requiring other (inverse) matrices
- Adjusting to the correct Transformation laws between coordinate systems and further coordinate changes to spherical angles
Accomplishments that we’re proud of
- Finding a thought-through (with considerations regarding both symmetry and physical effects) solution that fulfills all the given requirements
- Beautiful visualizations that help the intuitive understanding in 2D and 3D
- Strong validation of our results using the two independent approaches (Python and Unity implementation)
What we learned
- How to project spherical coordinates with respect to a reference frame onto the 2D equirectangular map of the earth.
- How a bottom-up approach (2D), combined with a top-down approach (3D), helped our understanding, i.e. the geometric 3D visualizations of the visibility cones of the satellites confirming the proposed consideration from 2D.
What’s next for HamilTUMian
There are a lot of further steps that could be undertaken:
- Checking, if it is possible to leave out the geostationary orbits We do not have a 100% working matching algorithm that determines which area is covered by which satellite. We know how to implement it and that it works; we simply did not have enough time to implement it
- Minimize the number of used satellites Consider more ‘real world’ constraints like allowed heights of the satellites, allowed & not allowed orbits for them, etc.
- Using evolutionary machine learning to solve the problem (it would be interesting to know what the outcomes there would be)